In order to predict the peak hour traffic flow for horizon period 2021 and 2041, base year traffic flow estimation needs to be done. Therefore, major road networks are considered and prediction model was formulated by incorporating abutting land use and right of way as input parameter.
Initially, data gathered from traffic volume count survey at 12 different locations in the study area was used for model development. Thus, model was built to capture the traffic flow relation with these input parameter and thereby, form a fully loaded network for the base year. Map below shows the links chosen for prediction of traffic flow for horizon period.
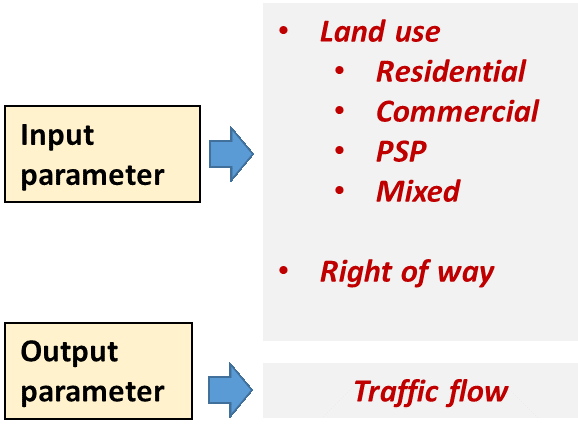
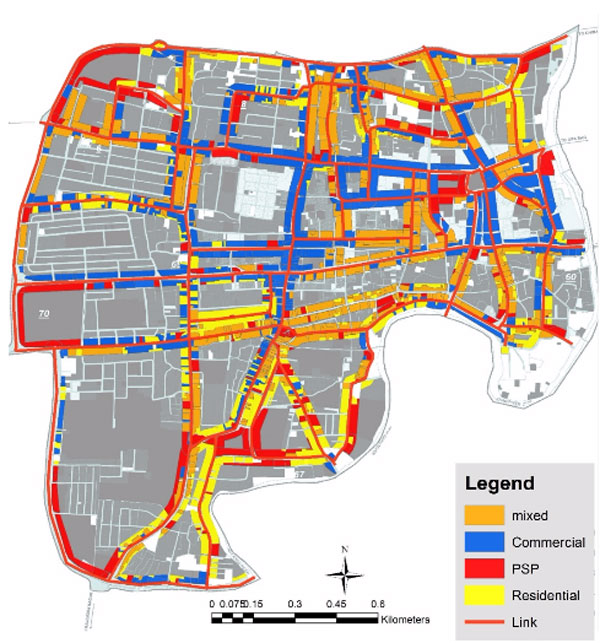 Figure: Links taken for Traffic Flow Prediction
A correlation test was carried out between selected parameters and traffic flow observed in the road section, which helps to achieve better prediction model. The selected parameters shows a better correlation value. Figure below shows the accuracy of model by plotting the observed and estimated value.
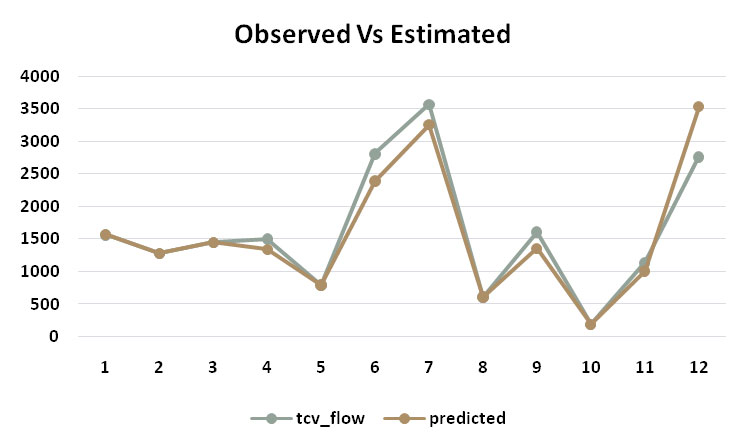
The scattered plot of observed and estimated values shows R value 0.91 which shows a better accuracy. Thus, model further used for creating fully loaded network for the base year.
Traffic flow for the base year was estimated from the above model. The maximum observed traffic flow is 3530. Figure on right shows the base year estimated traffic flow on selected links.
The links that shows major traffic flow are given below:
Existing condition of major roads like MG road, Jawahar marg, Dhar road experiences parking issues road side, undivided carriage way that minimizes its capacity as well as creating conflict points on road sections due to improper turns. MG road and Jawahar marg currently acts as linkage for surrounding areas around the study area. Because of the commercial establishments in core area, heavy traffic was observed around the heritage precinct. Southern part of the study area with its major residential land use comprises less traffic volume comparatively.
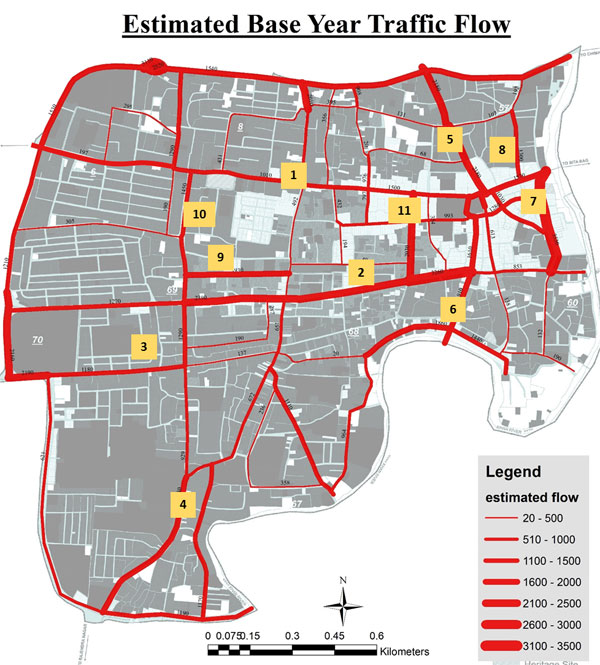 Figure: Estimated Traffic Flow for Base Year
Theoretical capacity was calculated and compared among the effective capacity to evaluate the effective utilization of the infrastructure provided. Capacity calculation was based on IRC code 106-1990.
Maps below show theoretical capacity and effective capacity for the road network in study area. Overall Network capacity observed to be reduced by 22% when comparison with effective capacity as cause of unorganized Parking, Encroachment etc.
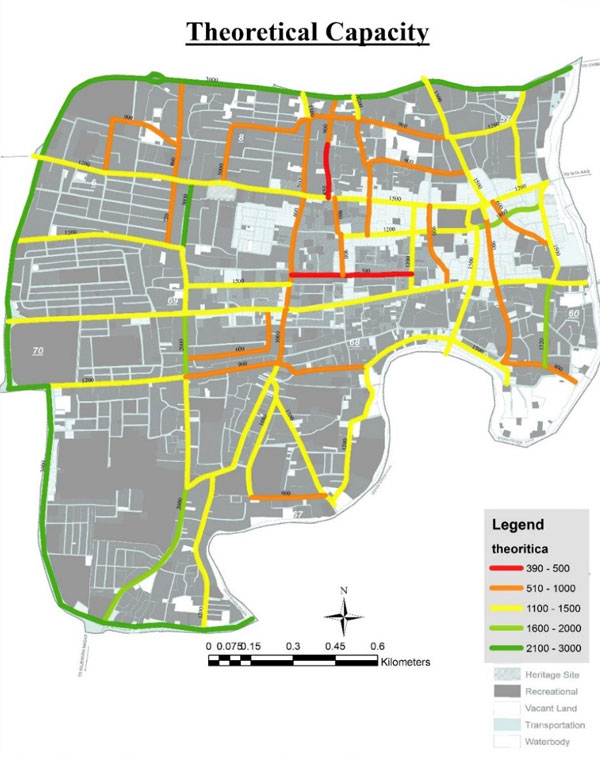
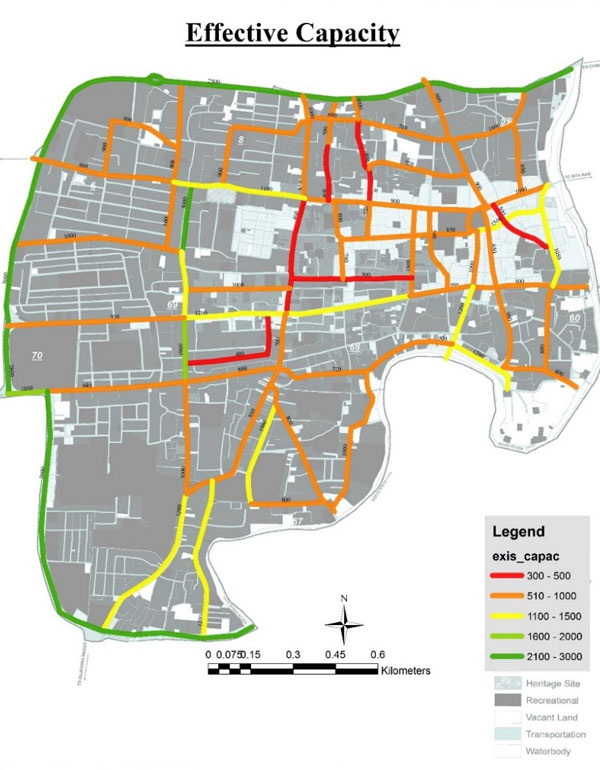
Theoretical capacity of road section reduced mainly in the core area around the heritage precinct because of heavy pedestrian movement, parking, loading and unloading activities etc. These causes are as result of predominant commercial and mixed land uses. MG road, Jawahar marg, Dhar road and roads in and around Rajwada shows a decrease in its road capacity mainly because of abutting commercial and mixed use activities leading to unorganized parking reducing its effective carriage way width.
The Level of Service computed based on considering both theoretical and effective capacity, in order to identify the roads which need serious improvement or upgradation. Level of service was calculated as ratio of volume by capacity prescribed in IRC code. 12 road sections are identified for improvement only by considering the shortages in the theoretical capacity, needs special attention. Figure 12 shows the LOS based on theoretical capacity. Major roads identified for improvement under this category includes:
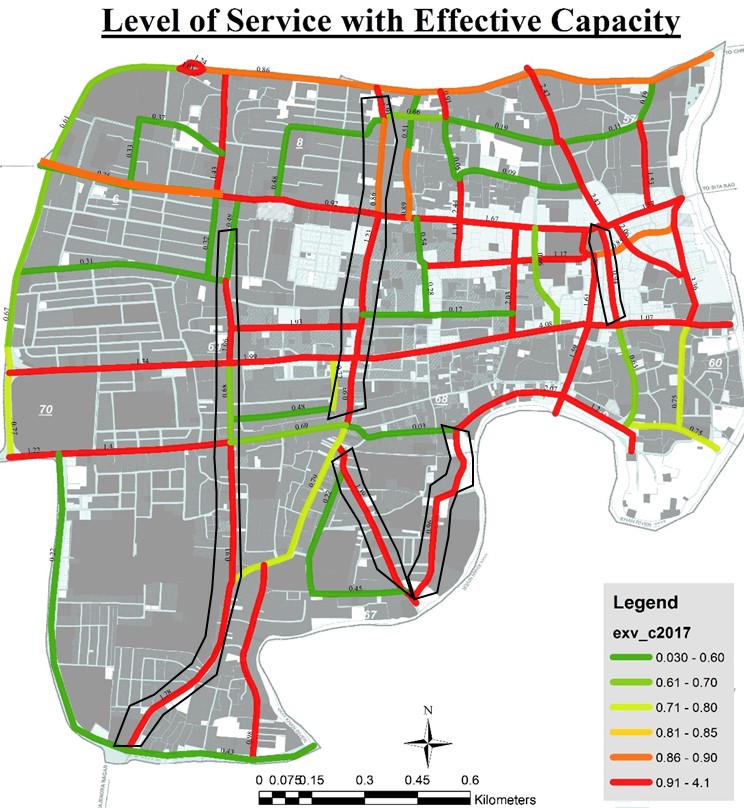 Figure: Level of Service with Effective Capacity
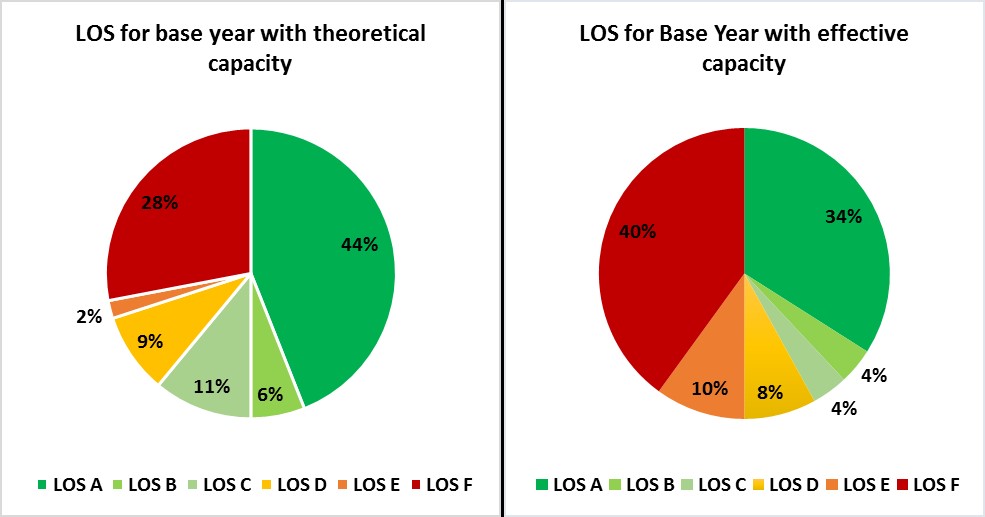
Level of service with effective capacity computed shows an average v/c ratio observed in all road sections falls under the Level of Service F which is more than v/c ratio 0.9. Average v/c ratio observed using theoretical capacity was 0.73 which falls under level of service C. Figure 13 and 14 shows the change in LOS with effective capacity. Four roads identified under effective LOS are as below:
Level of service for Netaji Subash marg reduced its LOS from A to E as a cause of the reduction in the effective carriage way. Theoretical capacity of Netaji Subash marg is 3000 for undivided carriage which can be improved to 3600 just by converting it into a divided carriage way.