Following locations were identified as water inlet points to the ABD project Area;
| Water Input to ABD Area | |||
|---|---|---|---|
| Source | Location | Water Supply | |
| Devdharam WTP | At Bada Ganpati Sq. | 5.56 | ML |
| Narmada | JINSI Hat ESR | 2.21 | ML |
| Narmada | Subhash Chowk ESR | 2.72 | ML |
| Narmada | Chhatribagh | 3.23 | ML |
| Total Water Input at ABD Area | 13.72 | ML | |
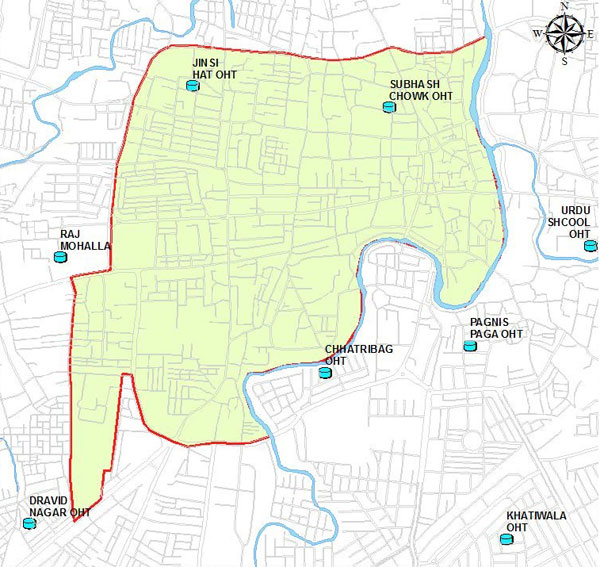 Figure: Location of ESRs in ABD Area
Thus, the ABD Project area is receiving 13.72 ML water every alternate day for distribution to water consumers.
Apart from above, direct supply points or tapings to feeder mains were also observed in the project area. As the tapping points for sources are scattered and needs to install the flow meters for better accountability. It has been observed that in absence of flow measuring devices, the dispute between actual water supplied is a routine affair. Hence, IMC shall install flow meters immediately.
There are 3 ESRs which are marked and shown in Figure.
The existing pipelines distribution network of the ABD Project Area are shown in Figure;
The total length of the existing distribution network in the ABD Project Area is around 76.53 km. % Share of Length of different pipes in the distribution system are 58% of the pipe length is of ACP, 22% is CI, 8 % DI, 3% HDPE, GI & PSC and 2% MS. The majority of pipe laid is Asbestos Concrete pipes. The distribution network of ABD project area is very old and dilapidated condition and most of the pipes required complete rehabilitation and revamping with inclusion of leak proof pipe and material in order to provide the quality water. The network assessment suggests high level of UFW in the existing network.
Ward wise connection details collected from IMC and estimated water connections is calculated based on the % ward area covered under the ABD project area for the corresponding ward. There may be approximate 11,854 connections in ABD area. This figure may increase as per actual condition which can be verified by property survey method.
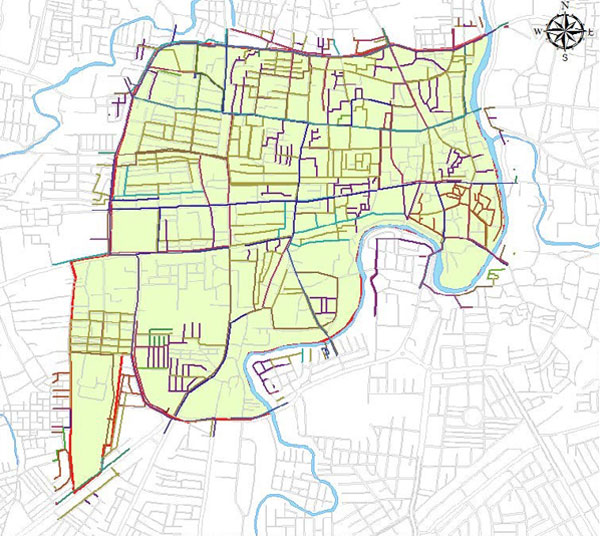 Figure: Water Supply Distribution Network in ABD Area
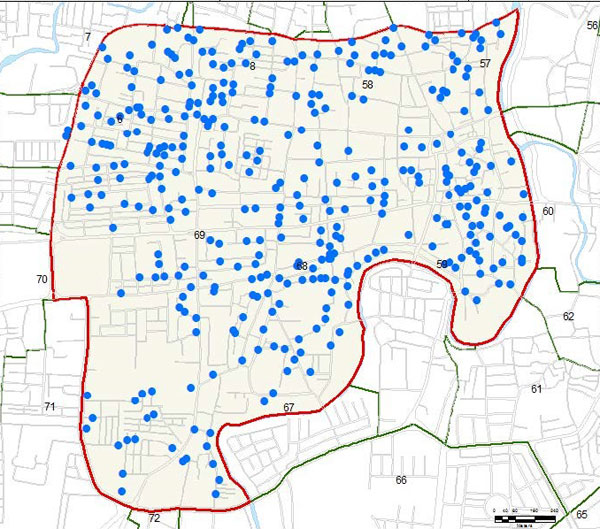 Figure: Location of Bore Wells in ABD Area
As per the data collected from IMC, there are total 350 nos. ground bore wells in the ABD Project area. The bore wells are being operated for average 2 to 3 hrs depending upon the water scarcity area. The energy bills are being paid by IMC. The locations of the bore wells are represented on the map;
Water Quality sampling is being performed by IMC at production as well as distribution level. The hygienic standards of safe and potable water supply to the consumer in IMC area rests with IMC. As per data provided by Water Quality Testing Department of IMC, for the period from Jan 2015 to Sep 2015, it can be observed that out of 12314 samples tested during 9-month period, 11091 samples were fit and 1223 samples tested unfit. 10% samples of the total samples tested were unfit for drinking water purposes.
Following are the critical issues prevailing with existing water supply system hence resulting into gap between water management & citizen services
As per the DPR of water supply total demand of water in 2020 is 28.1 MLD. The calculation is done based on target of 150 lpcd of water in ABD area. The demand in 2035 and 2050 is 34.69 MLD and 42.09 MLD respectively.
Table 1: Future Water Demand
| Year | Population | Water Demand (in ML) | Fire Demand (100(P)^0.5) | Total Demand (in ML) | Total Demand (10% dist. Loss) |
|---|---|---|---|---|---|
| 2020 | 166349 | 31 | 0.35 | 25 | 28.10 |
| 2035 | 205550 | 25 | 0.39 | 31 | 34.69 |
| 2050 | 249687 | 37 | 0.43 | 38 | 42.09 |